Travel Fatigue Effects on NBA Team Efficiency Ratings Tracked Through Advanced Statistical Services
Iris Hoffmann · Jul 10, 2026
Travel Fatigue Effects on NBA Team Efficiency Ratings Tracked Through Advanced Statistical Services
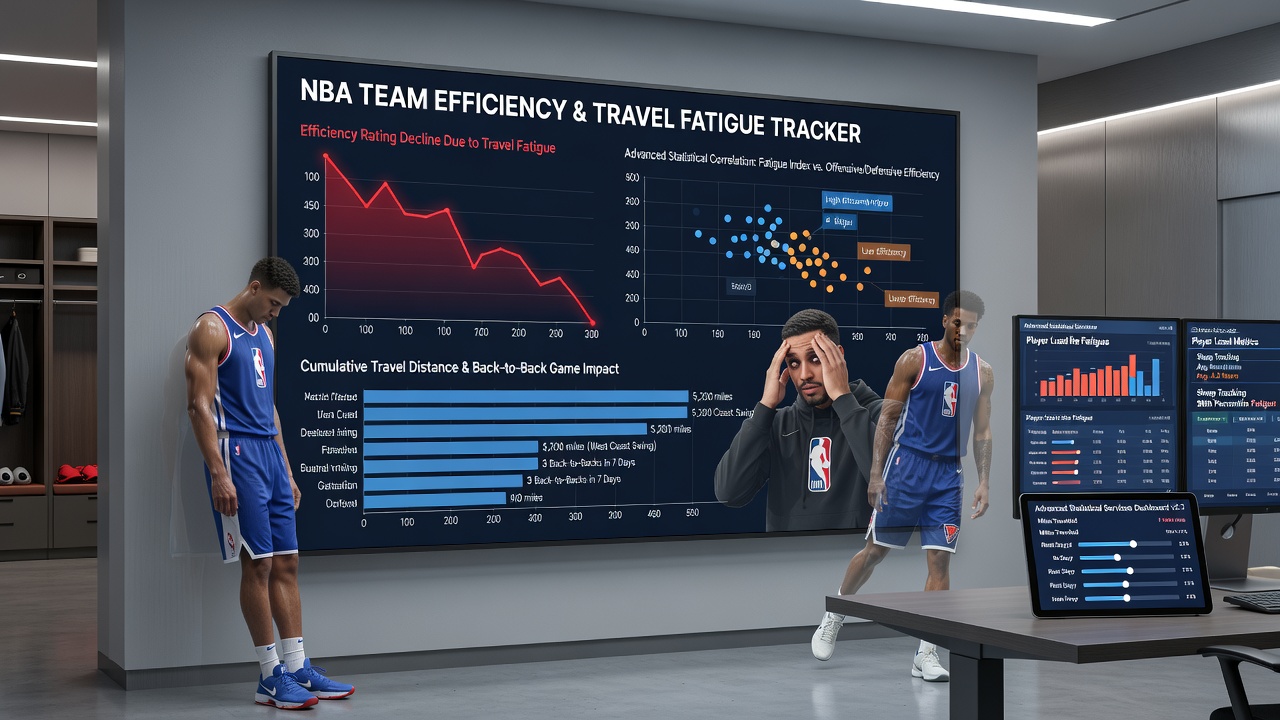
Travel fatigue has become a measurable factor in NBA performance as teams navigate demanding schedules that span multiple time zones and consecutive games. Advanced statistical services compile data on efficiency ratings, which include offensive efficiency measured in points per 100 possessions along with defensive efficiency that tracks opponent scoring rates, and these metrics reveal consistent patterns tied to travel demands. Researchers at sports analytics organizations have documented how back-to-back games combined with long flights correlate with declines in shooting percentages and turnover rates across multiple seasons.Measuring Efficiency Ratings in Context of Travel
Advanced statistical services such as those used by league partners and independent trackers process play-by-play data to calculate efficiency ratings that adjust for pace and opponent strength. These systems flag instances where teams play after crossing three or more time zones, and the resulting datasets show average drops in offensive efficiency by 3 to 5 points per 100 possessions in the first game following such travel. Defensive efficiency tends to hold steadier in some cases because teams can rely on established schemes, yet transition defense often weakens when fatigue accumulates during extended road trips.
Observers note that the NBA schedule makers release future calendars well in advance, and teams in July 2026 will begin reviewing preliminary schedules that include international events and compressed Western Conference travel. Data from these periods indicates that teams based in the Eastern Time Zone face greater cumulative fatigue when playing three-game West Coast swings, with efficiency metrics reflecting increased foul trouble and reduced assist-to-turnover ratios.
Role of Advanced Tracking Services
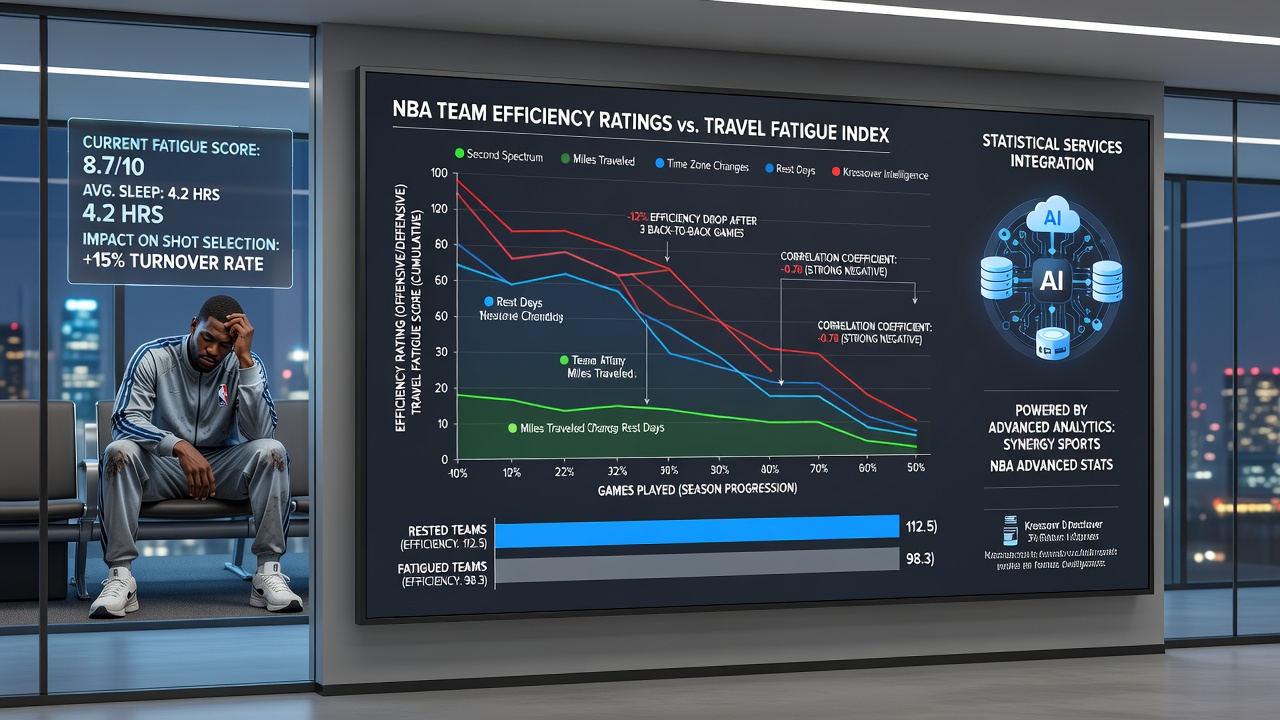
Services that integrate player tracking technology and second-spectrum data provide granular breakdowns of how travel influences specific actions such as sprint speed in transition or closeout distances on defense. These platforms aggregate information across hundreds of games each season, allowing analysts to isolate travel as a variable while controlling for rest days and opponent quality. Patterns emerge where teams on the second night of back-to-backs after flights longer than four hours post lower field goal percentages inside the arc, and advanced models quantify these effects with regression analysis that accounts for seasonal trends.
Documented Patterns Across Seasons
Longitudinal data compiled through 2025 demonstrates that teams averaging more than 35,000 miles traveled per season experience measurable efficiency erosion during the second half of road trips, and statistical services highlight how these effects compound when games occur in successive nights. For example, one study of Western Conference clubs revealed that efficiency ratings dipped further when return flights landed less than 24 hours before the next tip-off. Researchers have also tracked how altitude changes, such as games in Denver followed by sea-level contests, interact with travel fatigue to influence rebounding percentages and block rates.
What's interesting is how different statistical services weight these variables, with some emphasizing load management data from wearable devices while others focus solely on on-court efficiency outputs. The convergence of these approaches strengthens the evidence that travel distance and time zone shifts produce predictable impacts on team performance metrics.
Integration with Broader Performance Analytics
Advanced platforms now combine travel data with injury reports and minutes-played logs to generate predictive models for upcoming matchups. These models show that teams with fewer than two days of rest after cross-country flights tend to allow higher three-point attempt rates to opponents because defensive rotations slow measurably. Efficiency ratings tracked in real time during games provide immediate feedback loops for coaching staffs, who adjust substitution patterns based on observed declines in player movement metrics.
According to reports from international sports science bodies, similar fatigue patterns appear in other professional leagues that require extensive travel, yet the NBA's 82-game schedule amplifies the cumulative load. Data services continue to refine their algorithms by incorporating airport delay information and hotel quality variables that can further influence recovery rates between games.
Conclusion
Advanced statistical services have established clear connections between travel fatigue and shifts in NBA efficiency ratings through consistent data collection and analysis. Teams and analysts use these insights to inform scheduling decisions and in-game adjustments, while the metrics themselves continue to evolve with improved tracking technology. As the league prepares for future seasons including those outlined in July 2026, the role of these services in quantifying travel effects remains central to understanding competitive balance across conferences.