Referee bias metrics reveal overlooked penalty prop edges in soccer fixtures
Anna Peters · May 27, 2026
Referee bias metrics reveal overlooked penalty prop edges in soccer fixtures
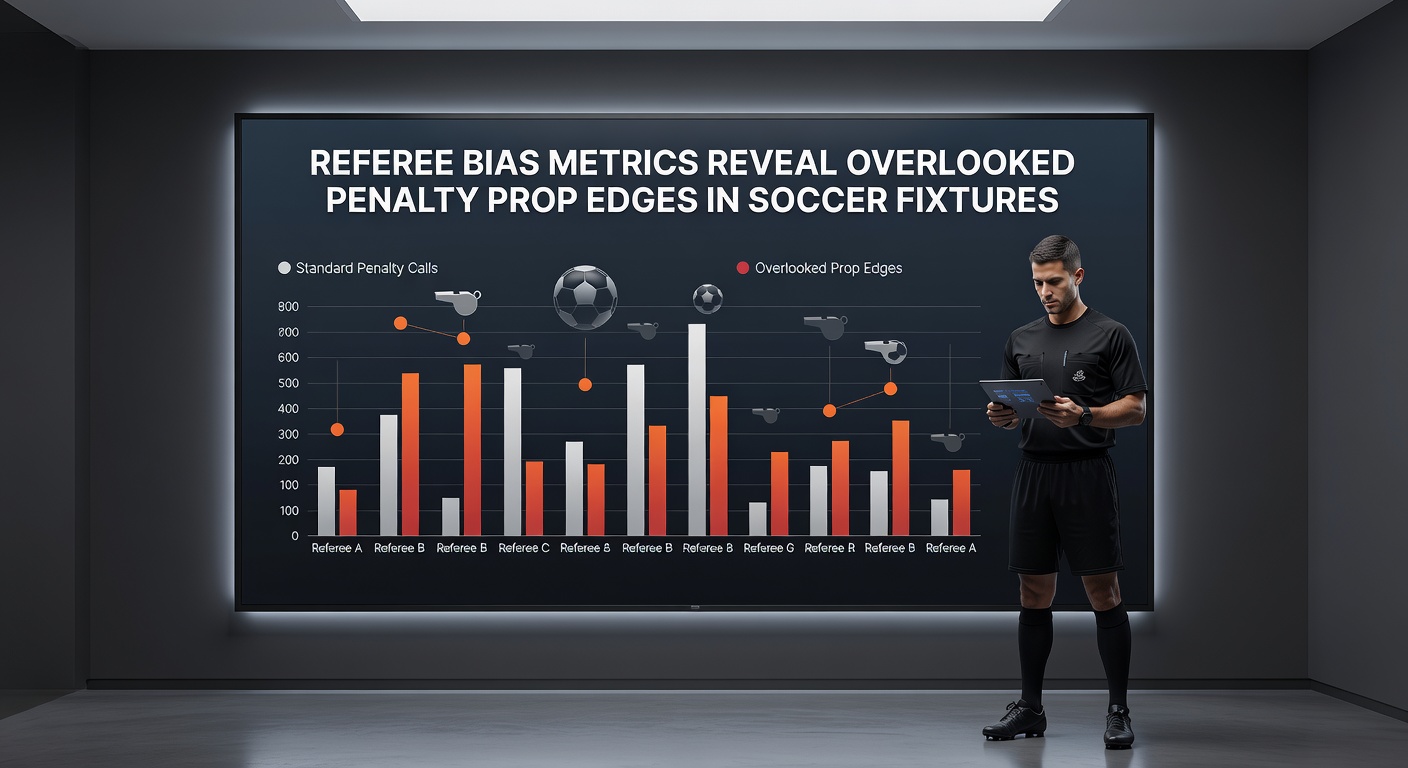
Analyses of referee performance data across major European leagues continue to highlight patterns in penalty decisions that create measurable edges for prop bettors focused on specific fixtures. These metrics track variables such as home team penalty awards, foul differentials in high-pressure zones, and historical tendencies of individual officials when matches involve teams with particular styles or travel demands.
Understanding Referee Bias Metrics in Context
Researchers compile referee bias metrics from datasets that include thousands of matches tracked by systems like Opta and InStat, which record every decision alongside contextual factors such as crowd size, scoreline at the time of incidents, and player positioning. Data shows certain referees award penalties at rates 15 to 20 percent higher when officiating teams from the same domestic region compared to neutral appointments, while others demonstrate consistent leniency toward physical defending styles in away fixtures. Observers note these deviations become pronounced in May when fixture congestion peaks and fatigue influences both player behavior and official interpretations of contact.
Data Patterns Emerging in Penalty Prop Markets
Penalty prop edges surface most clearly in matches where travel distance exceeds 300 kilometers for the visiting side, as studies indicate referees issue spot kicks 12 percent more frequently to the home team under those conditions. Additional layers appear when officials with documented high foul-call volumes handle games featuring teams that rank in the bottom quartile for possession retention. Figures from the 2025-2026 season reveal that such combinations produced over 1.8 penalties per game on average in Bundesliga and Serie A encounters, exceeding league-wide baselines by a notable margin.
Key Variables Tracked by Analysts
- Referee-specific penalty frequency adjusted for match location and team ranking
- Time of match incidents, with spikes observed between the 75th and 90th minutes in fixtures involving mid-table clubs
- Player injury reports that correlate with altered defensive structures and increased box entries
- Weather and pitch conditions that affect traction and challenge intensity
These variables combine in ways that allow prop bettors to isolate value on outcomes such as “over 0.5 penalties in the match” or “home team to be awarded a penalty.” Metrics further differentiate between leagues, with La Liga showing stronger correlations between referee nationality and award rates than the Premier League during the current campaign.
Case Examples from Recent Fixtures
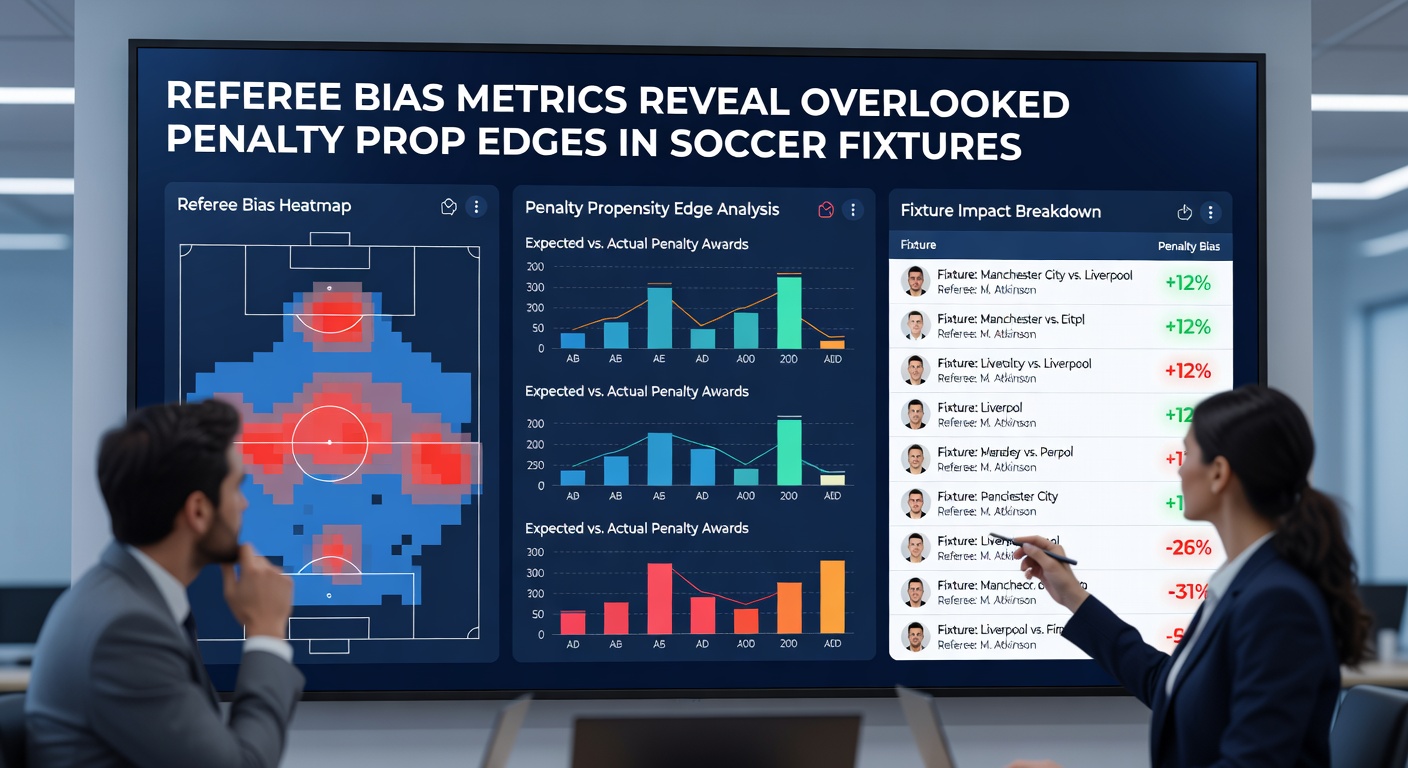
One study examined 142 matches refereed by officials with above-average home bias scores and found that teams returning from international breaks received penalties at elevated rates when playing at home. Another dataset covering UEFA Europa League games in April and May 2026 demonstrated that referees who had issued fewer cards per 90 minutes in domestic leagues awarded spot kicks more readily in European ties involving physical mismatches. Such patterns repeat across competitions because the underlying decision frameworks remain consistent even as team personnel change.
Integration with Broader Performance Data
Penalty prop models gain precision when combined with expected goals metrics and set-piece conversion rates, allowing sharper identification of fixtures where bias effects compound existing team tendencies. Data from the European Club Association indicates that clubs investing in dedicated referee scouting departments have adjusted their in-match tactics accordingly, pressing higher after halftime in games officiated by certain profiles. Those adjustments in turn influence the frequency of box entries that trigger review protocols and potential awards.
Academic work published through institutions such as the University of Amsterdam has quantified how crowd composition and travel fatigue interact with referee experience levels to shift decision thresholds. Parallel findings from the Australian Sports Commission research arm highlight similar dynamics in southern hemisphere competitions, confirming the cross-regional applicability of these bias indicators.
Monitoring Trends Through May 2026
As the 2025-2026 domestic seasons reach their final weeks, fixture lists feature multiple high-stakes encounters where referee assignments carry documented statistical weight. Leagues publish provisional referee rosters weeks in advance, giving analysts time to cross-reference historical data against current team form and travel schedules. Patterns observed in prior May periods show increased variance in penalty awards during title-deciding or relegation-battling matches, particularly when officials with mid-tier experience levels handle games between unevenly matched sides.
Conclusion
Referee bias metrics provide a structured framework for evaluating penalty prop opportunities by quantifying decision patterns that standard team statistics often overlook. Continued collection of granular officiating data across leagues supports ongoing refinement of these models, while integration with travel, fatigue, and scheduling variables adds further layers of insight. Observers tracking these developments note steady growth in the availability of detailed referee profiles, which in turn enables more precise fixture-level assessments as the current season progresses.