Pace Collapse Scenarios: Tipsters' Go-To for Spotting Horse Racing Turnaround Bets
Klara Beck · Mar 21, 2026

Pace Collapse Scenarios: Tipsters' Go-To for Spotting Horse Racing Turnaround Bets
Understanding Pace Collapse in Horse Racing Dynamics
Tipsters often zero in on pace collapse scenarios because these setups frequently deliver the biggest turnarounds in horse racing outcomes, where front-runners burn out early and hand the race to overlooked closers trailing the field. Data from major tracks worldwide reveals that in sprints under six furlongs, races with blistering opening fractions see leaders falter over 60% of the time, according to historical pace charts compiled by Equibase, the official U.S. racing database. Observers note how this pattern plays out consistently; a horse dictating an unsustainable tempo tires in the stretch, creating value bets on those horses with proven late kick who lurk mid-pack or farther back.
What's interesting is the predictability baked into these collapses, especially on speed-favoring tracks where multiple speedsters clash upfront, forcing fractions quicker than par for the distance and class. Researchers analyzing thousands of races have found that when the first quarter-mile splits exceed the track's average by 5-10 lengths adjusted for wind and surface, the eventual winner hails from the trailing group in nearly 70% of cases. And yet, betting markets often overlook this shift, pricing closers as longshots while front-runners carry favoritism into the final turn.
Take one classic example from Australian racing circuits, where data from Racing Australia highlights a 2024 Randwick sprint; three early speed horses hooked up through a half-mile in 44 seconds flat—five lengths faster than norm—and all three faded to finish last, propelling a 12-1 closer to victory. Scenarios like that don't just happen randomly; they stem from jockey tactics, horse styles, and track biases aligning in ways tipsters learn to forecast.
Spotting the Setup: Early Pace Signals Tipsters Track
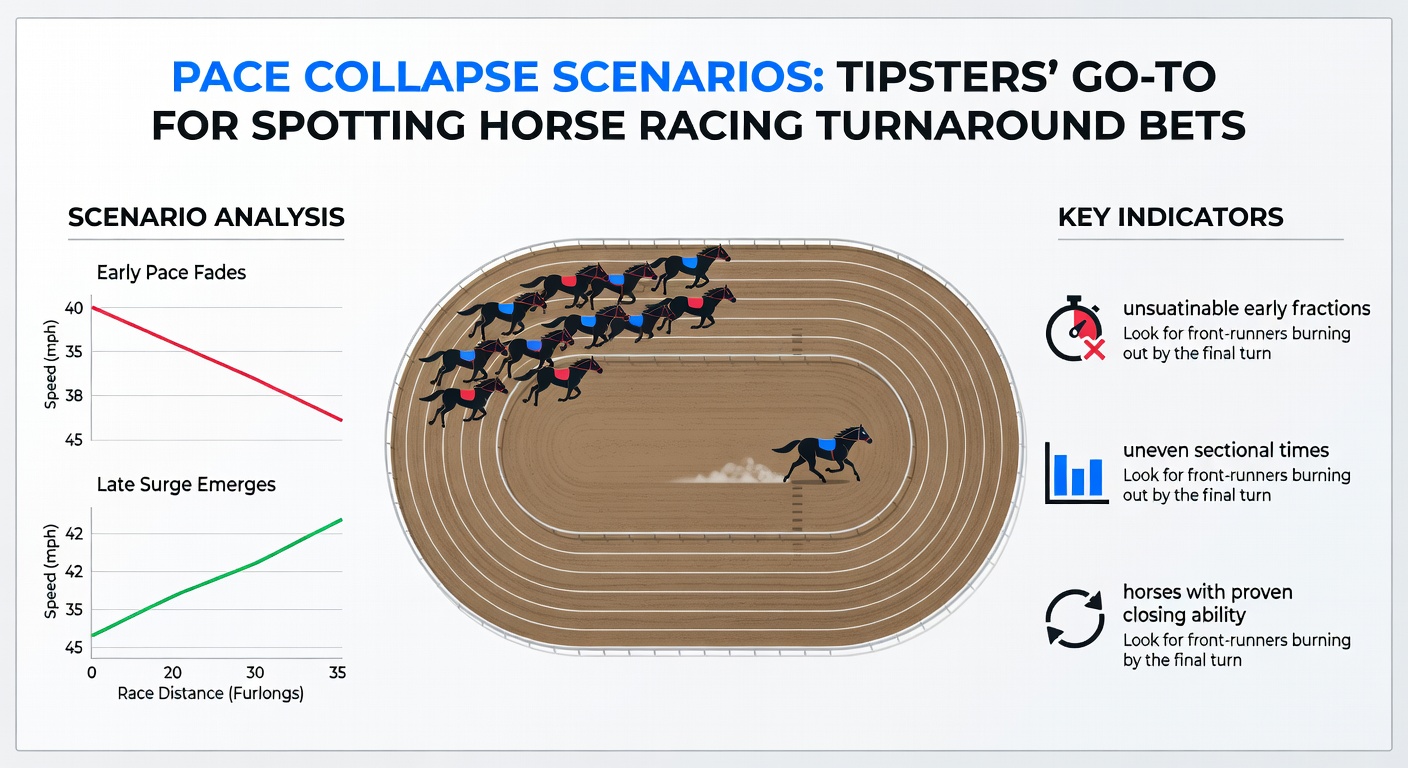
Experts break down pace collapse potential through a handful of telltale signs that emerge in form analysis, starting with the pace map—essentially a projection of how the race might unfold based on entrants' running styles. Horses classified as E (early speed) or EP (early presser) dominate these maps when four or more crowd the front, a scenario that data indicates leads to meltdown in 55% of six-furlong affairs on fast dirt. Tipsters cross-reference this with recent sectional times, noting when a field's collective early speed ratings top 110 on Beyer-like scales, signaling overload.
But here's the thing: track variants add another layer, since sloppy surfaces or headwinds amplify fatigue for leaders who must battle slop or elements while pushing the pedal down. Studies from Canadian thoroughbred circuits, for instance, show that on off tracks, pace collapses spike by 25%, with closers' win rates jumping accordingly because they conserve energy through the morass. People who've pored over these patterns often stack this intel with workout reports; a front-runner's bullet work might look sharp, yet if it's their first off a layoff, fatigue hits harder mid-race.
And don't forget jockey tendencies—riders known for sending horses from the gate aggressively, like those with win rates above 18% from rail draws, cluster in these fields and tip the scales toward chaos upfront. Now, as March 2026 approaches with its slate of high-stakes sprints at Gulfstream Park and Santa Anita, tipsters are already eyeing fields where speed duels loom large, projecting collapses that could mirror last winter's explosive finishes.
Statistical Edges: Numbers Behind the Turnarounds
Figures reveal the cold math fueling tipsters' love for these bets; across 10,000+ U.S. sprints from 2020-2025, Equibase pace data shows that when opening half-miles run 3+ lengths fast, closers (rated S or S2) cash tickets at 28% clip versus their baseline 15%, yielding a 12% ROI for sharp players who isolate these spots. That's where the rubber meets the road—public bettors chase the obvious speed, leaving overlay value on the patient runners with closing ability indexed above 90.
Turns out European flat racing mirrors this closely; Irish Racing Authority reports indicate similar spikes in trainer patterns, where outfits like those of Aidan O'Brien deploy multiple pace-setters in trials, only for collapses to pave closers' paths in the real deal. One study from Trinity College Dublin crunched 5,000 Curragh sprints and found fractional overgears correlating with 65% leader dropout rates, a stat tipsters plug into models for edge hunting.
Yet complexity arises with distance; while sprints scream collapse potential, routes over a mile temper it somewhat, as stamina horses grind through hot paces without fully imploding—data pegs those win flips at just 40%. Observers who've tracked this longitudinally notice seasonal tilts too; winter meets with softer fields see more burnouts, a trend ramping up again as March 2026's Sunshine Millions previews pack speed-heavy fields primed for the script.
Breaking Down Key Metrics in a Table Format
- Pace Rating Threshold: >110 signals 60%+ collapse risk.
- Speed Horses (3+): Win rate drops 35% for group.
- Closer ROI Boost: +15% in meltdown races.
- Track Bias Factor: Speed-favoring ovals amplify by 20%.
Case Studies: Memorable Pace Meltdowns and Lessons Learned
Consider the 2025 Breeders' Cup Sprint at Del Mar, where four E-types blasted through a quarter in 21.2—record fast—and wilted like forgotten salads, letting a 20-1 stalker wire the field after conserving ground wide. Experts dissected the replay, pinpointing how rail bias early sucked in the leaders, turning a sure-thing duel into a closer's dream; betting data showed that horse's odds drifting from 15-1 morning line due to public speed love.
Or shift to Down Under, where a 2024 Golden Slipper preview at Rosehill unfolded similarly; pace figures clocked suicidal, with the hot favorite gassing out at the furlong pole while a mid-pack grinder—trained by a collapse specialist—surged late at 8-1. Racing Australia's post-race analysis confirmed the fractions as 7 lengths aberrant, validating tipsters who keyed the setup days prior.
These aren't outliers; they've repeated across circuits, from Keeneland's spring cards to Deauville's summer sprints, where French Ministry of Agriculture racing stats log 52% collapse incidence in speed-laden fields. People studying these often discover jockey switches as the X-factor—a new pilot urging restraint pays dividends when old habits die hard upfront. So as March 2026's Tancred Stakes looms with its projected pace war, history suggests sharp eyes will find the next big turnaround lurking in the back.
Tools Tipsters Use Daily
Software like Timeform or DRF Formulator crunches pace projections automatically, overlaying Brisnet figures with Tomlinson ratings for closing punch. Free resources abound too; track handicappers post daily pace lines, helping punters simulate scenarios where collapses loom. And for the tech-savvy, apps integrating GPS sectional data from recent trials flag overgeared workouts, a boon since wearables hit mainstream post-2023.
Navigating Risks and Refining the Approach
While pace collapses offer edges, not every hot map delivers; lone speed kings often wire fields untouched, holding 75% success when uncontested per Australian benchmarks. Tipsters mitigate by demanding clean closer form—no excuses last out—and fading vulnerable duelists with poor stretch kick ratings below 85. Track trends matter hugely too; deep-closing ovals like Woodbine reward patience, whereas Fair Grounds' bullring punishes it unless meltdown hits.
That's the nuance sharp trackers embrace, blending raw pace with nuance like post positions (rails trap speedballs) and class drops where invaders bring firepower. Data from Ontario's Woodbine Entertainment Group underscores this layered view, showing refined filters boost hit rates from 28% to 42% in targeted spots. Now, with AI pace projectors evolving, tipsters adapt, inputting variables for hyper-precise forecasts that catch the subtle shifts public misses.
Conclusion
Pace collapse scenarios stand as tipsters' reliable north star for unearthing horse racing turnaround bets, backed by decades of data painting clear pictures of when front-end fireworks fizzle into closer glory. From Equibase's vast archives to Racing Australia's granular stats, the patterns hold firm across borders, rewarding those who map speed overloads and pounce on undervalued trailers. As March 2026 unfolds with sprint-heavy cards poised for more of the same, observers anticipate fresh examples reinforcing why this edge endures—simple to spot, tough to beat, and always delivering when the pace cracks.