Mapping Travel Distance Effects on Away Game Success Rates in Professional Leagues
Yves Werner · Jul 8, 2026

Mapping Travel Distance Effects on Away Game Success Rates in Professional Leagues
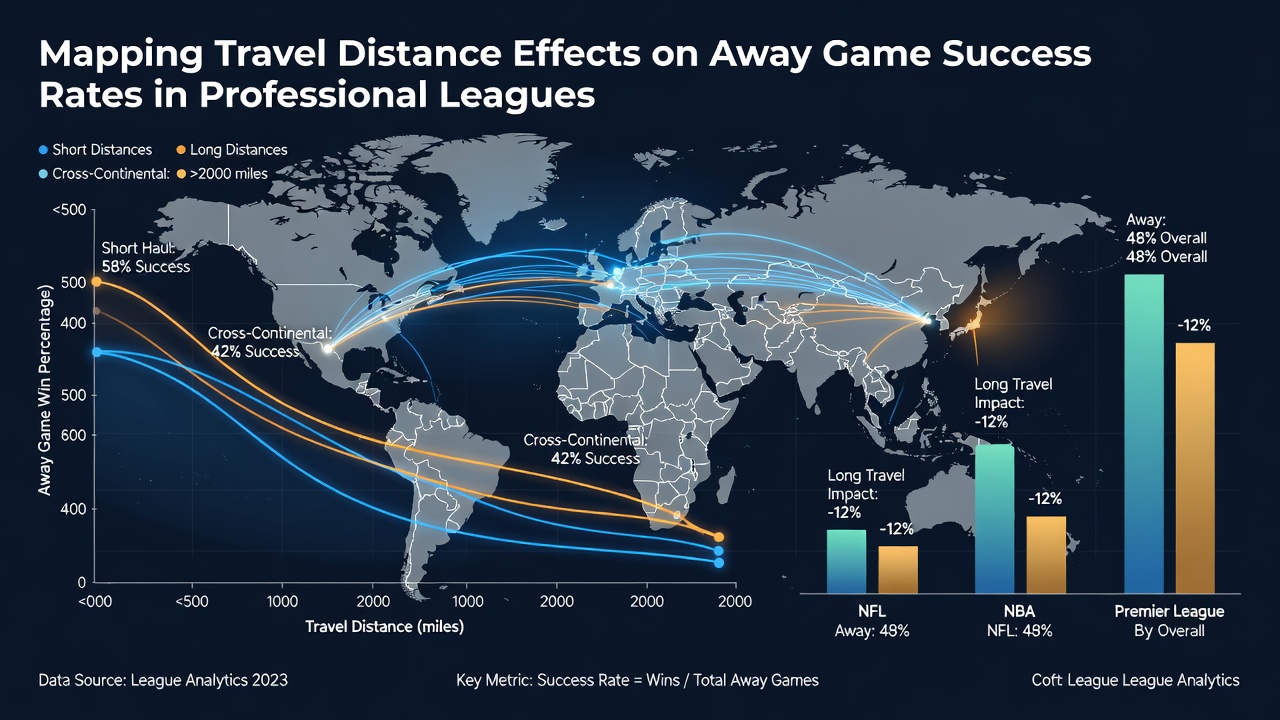
Travel distance serves as a measurable factor that shapes away game outcomes in professional sports leagues around the world. Researchers track these patterns through detailed datasets that cover thousands of matches across seasons in basketball, soccer, football, and other major competitions. Data from these analyses reveal consistent correlations between miles traveled and reduced success rates for visiting teams, particularly when journeys exceed certain thresholds like 500 or 1,000 miles.
Key Patterns in Major Leagues
Analyses of NBA schedules show that teams logging more than 800 miles for an away contest post win percentages that drop by 4 to 7 points compared to shorter regional trips. Similar trends appear in NFL data where cross-country flights correlate with lower scoring outputs and higher injury reports in the immediate follow-up games. European soccer leagues present parallel findings where clubs traveling between distant domestic fixtures or into Champions League venues experience measurable dips in possession control and shot accuracy during the first half.
Observers note that these effects compound during condensed schedules. Multiple away legs within a seven-day window amplify the distance impact because recovery windows shrink and circadian adjustments lag behind. League statisticians compile these records season after season to map exact distance bands against win rates, creating visual heat maps that highlight high-risk travel corridors.
Measurement Methods and Data Sources
Modern tracking relies on GPS-derived travel logs combined with official game reports. Organizations such as the Australian Sports Commission publish periodic reviews that break down elite athlete travel across southern hemisphere competitions, while university-led projects in North America aggregate public schedule information into regression models. These models isolate distance as an independent variable while controlling for opponent strength, home advantage, and rest days.
July 2026 updates from several league analytics departments incorporated refined jet-lag indices that factor in time-zone crossings alongside raw mileage. The resulting datasets indicate that westward travel produces slightly steeper performance declines than eastward routes in North American leagues, whereas north-south movements within the same time zone show milder effects overall.
League-Specific Variations
Baseball schedules stretch across longer seasons and feature more back-to-back travel than most sports, yet data collected by Major League Baseball operations teams demonstrate that teams covering 1,200-plus miles still record away win rates approximately 5 percent below their season averages. In contrast, rugby union competitions in the southern hemisphere display sharper drops when transcontinental flights precede test matches, with lineout accuracy and scrum stability showing the clearest decrements.
International club tournaments add another layer because squads often combine long-haul flights with climate shifts. Records from Asian and South American confederation events illustrate how cumulative distance plus humidity exposure further depresses away performance metrics in the opening 30 minutes of play. Analysts adjust their distance models to include these secondary environmental loads when projecting fixture outcomes.
Recovery and Scheduling Adjustments
Leagues have begun testing schedule modifications that limit extreme travel clusters. Some conferences now insert extra rest days after flights exceeding 1,000 miles, and early results from those adjusted calendars show modest stabilization in away success rates. Medical staff monitor heart-rate variability and sleep data to quantify how quickly players return to baseline after such journeys, feeding those metrics back into the distance-mapping frameworks.
Equipment and support staff logistics also factor into the calculations. Teams that charter flights with optimized cabin pressure and meal timing report narrower gaps between home and away outputs, though the advantage remains small relative to raw distance traveled. Ongoing research continues to refine these variables within the broader statistical models.
Conclusion
Comprehensive mapping of travel distance against away success rates supplies leagues, teams, and performance staff with actionable benchmarks. Continued accumulation of granular data through 2026 and beyond allows for increasingly precise identification of high-impact travel scenarios, supporting targeted schedule tweaks and recovery protocols that address the measurable effects without altering competitive balance.