Mapping Player Workload Distributions to Identify Fatigue-Related Wagers in Multi-Competition Soccer Calendars
Klara Beck · Aug 23, 2026
Mapping Player Workload Distributions to Identify Fatigue-Related Wagers in Multi-Competition Soccer Calendars
Analysts compile detailed records of player minutes, travel distances, and recovery intervals from domestic leagues, cup ties, and continental fixtures while they integrate GPS data with match logs to build workload profiles that highlight accumulation patterns over extended periods. Teams in major European competitions often face schedules that pack multiple high-intensity games into short windows, and this creates measurable spikes in physical demand that correlate with subsequent drops in sprint frequency and pass accuracy according to figures released by the European Club Association. Observers note how clubs competing in the Premier League alongside the Champions League typically log over 60 matches per season for key squad members, whereas data from the 2025-2026 campaign shows several midfielders exceeding 3,500 minutes before the winter break. Researchers apply distribution models that segment these totals into acute and chronic load categories, and the resulting maps reveal clusters where rapid increases precede measurable declines in output metrics such as distance covered at high speed.Key Metrics and Tracking Methods
Performance analysts rely on a combination of external load indicators like total distance and accelerations alongside internal markers including heart rate variability and perceived exertion scores, yet they cross-reference these with fixture congestion indices to isolate fatigue signals from tactical adjustments. Studies conducted at universities in Australia and Canada demonstrate that players logging consecutive matches with less than four days between them exhibit a 12 to 18 percent reduction in high-intensity efforts during the second fixture, while league-wide datasets confirm similar trends across multiple seasons.
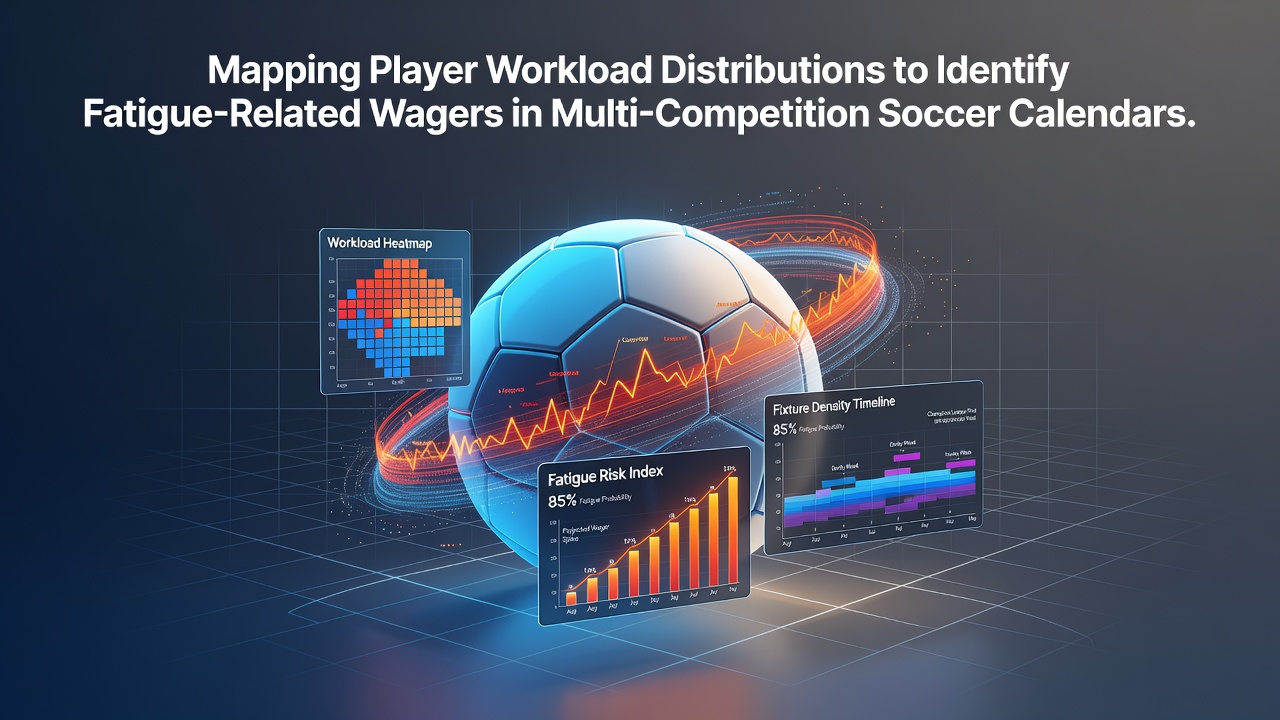
Software platforms aggregate these variables into heat maps that color-code squads by cumulative stress, and betting markets have begun incorporating similar overlays when setting lines on individual player props or team totals. One dataset covering the Bundesliga and Serie A from 2023 onward illustrates how teams with four or more players above a defined workload threshold concede more shots from distance in the following match, a pattern that holds across home and away contexts.
Calendar Congestion in Multi-Competition Environments
Expanded tournament formats scheduled to begin in August 2026 will add extra rounds to the calendar for top clubs, and this development amplifies the need for precise workload mapping because recovery windows shrink further when intercontinental travel is involved. Figures from CONMEBOL and UEFA technical reports indicate that South American and European sides traveling across time zones experience an additional 15 percent spike in soft-tissue injury reports during the subsequent fortnight.

Coaches rotate personnel more aggressively in these windows, yet rotation itself introduces variability that workload models capture through position-specific thresholds rather than blanket minute limits. Data indicates that fullbacks who exceed 2,800 minutes across all competitions show steeper declines in crossing accuracy compared with central defenders under similar loads, and these differentiated curves allow for granular identification of edges in player performance markets.
Application to Wagering Decisions
Market participants examine workload distributions to flag matches where a starting XI contains multiple high-load players returning from midweek continental ties, and historical results from the 2024-2025 season reveal that such lineups produce under 2.5 goals in 58 percent of domestic league fixtures. Analysts adjust expected goal models by layering fatigue modifiers derived from rolling four-week load averages, while they test these adjustments against outcomes reported by the German Football League and the English Football Association.
Sharp observers track substitution patterns as indirect signals of workload management, because clubs that make early changes to rested players often signal elevated fatigue elsewhere on the pitch. A review of over 1,200 matches across five leagues found that sides with three or more players above chronic load thresholds win 9 percent fewer points than their season average in the immediate next fixture, providing a quantifiable input for handicap and totals calculations.
Conclusion
Mapping techniques continue to evolve with improved sensor technology and machine-learning refinements that refine fatigue thresholds on a per-player basis. As calendars grow denser ahead of the 2026 expansion, these distributions supply clubs and analysts with structured inputs that link physical accumulation directly to performance variance across competitions. The resulting data layers integrate into existing statistical frameworks without replacing traditional form or tactical analysis, and they offer additional context for evaluating outcomes in congested periods.