Exploring Variance in Player Recovery Timelines After High-Intensity Matches to Guide Future Performance Projections in Team Events
Iris Hoffmann · Jun 12, 2026
Exploring Variance in Player Recovery Timelines After High-Intensity Matches to Guide Future Performance Projections in Team Events
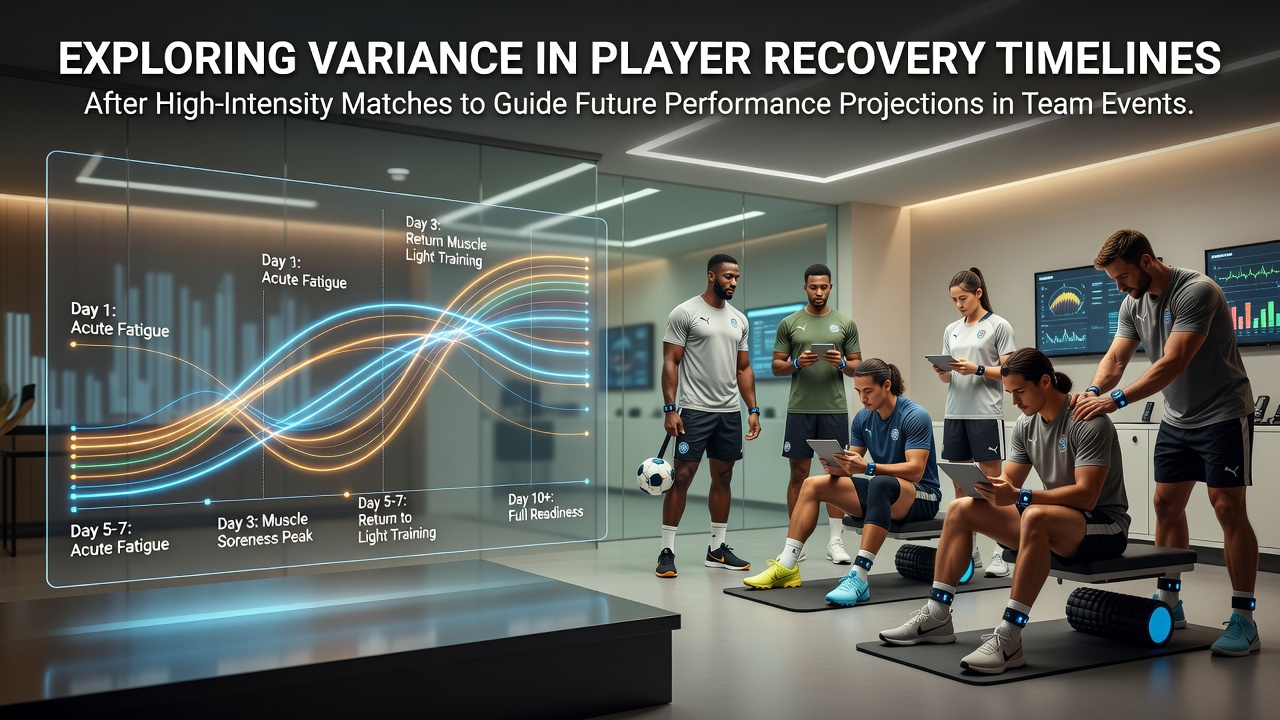
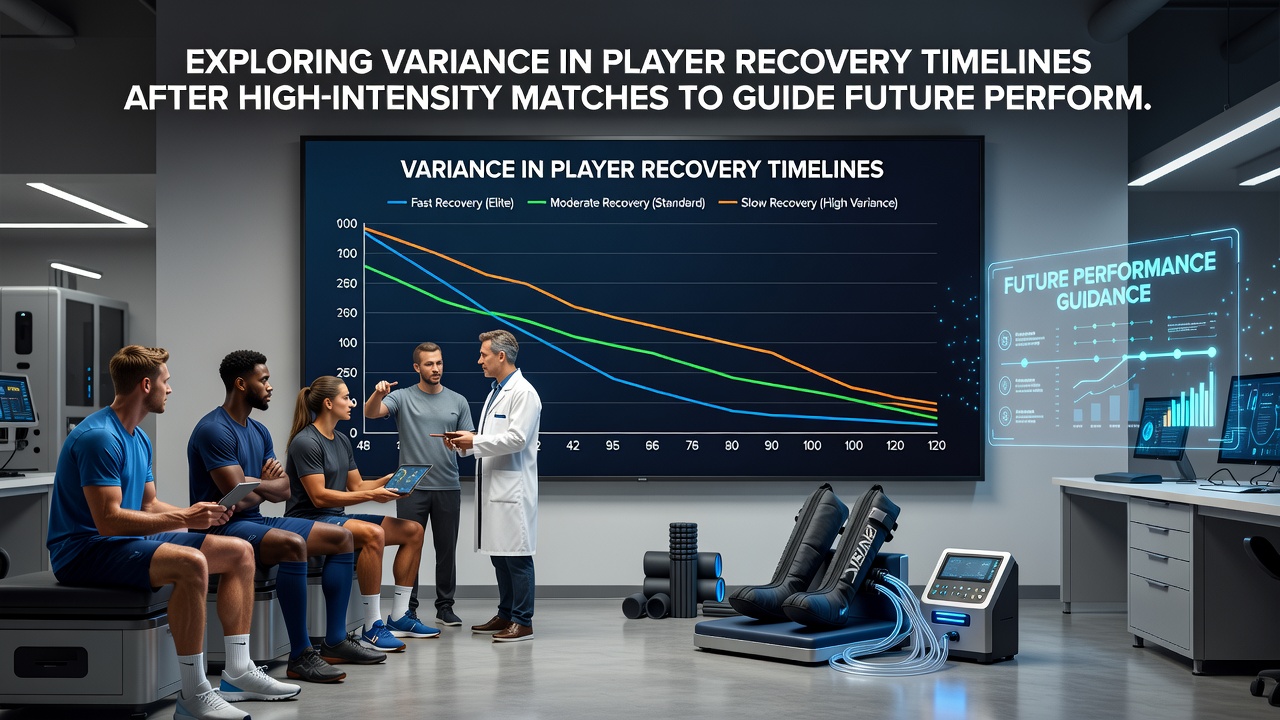
Recovery timelines after high-intensity matches show considerable variance across players and sports, with data from multiple studies highlighting differences that range from 48 hours to over 120 hours for full physiological restoration. Researchers have tracked markers such as heart rate variability, muscle soreness, and glycogen replenishment in team environments where back-to-back fixtures occur frequently. Those patterns become especially relevant in June 2026 as leagues worldwide prepare condensed schedules that include international tournaments and domestic cup finals.
Key Physiological Factors Driving Recovery Differences
Individual responses to match demands depend on several measurable elements including age, position, and prior workload accumulation. Midfielders in soccer often record higher total distances covered compared to goalkeepers, leading to extended periods needed for neuromuscular recovery according to findings published by the National Institutes of Health. Creatine kinase levels spike more sharply in younger athletes yet return to baseline faster than in veterans over 30, a distinction documented across multiple European club cohorts. Sleep duration and nutrition timing further modulate these outcomes, with data indicating that athletes averaging under six hours of rest per night experience 20-30 percent longer inflammation resolution periods.
Data Patterns Observed in Recent Seasons
Analyses of elite competitions reveal consistent clusters of recovery variance. One longitudinal review covering 12 professional teams found that 65 percent of players regained sprint performance within 72 hours while the remaining cohort required an additional 24-48 hours. These distributions shift during congested calendars when matches occur with less than four days between them. Observers note that defensive units sometimes exhibit quicker return to baseline because their high-intensity efforts concentrate in shorter bursts, whereas attackers accumulate more eccentric loading from repeated accelerations and decelerations.
Figures from the Australian Institute of Sport demonstrate similar spreads in rugby and Australian rules football, where positional demands create distinct recovery curves. Teams that integrate daily wellness questionnaires alongside GPS and heart-rate data identify outliers earlier, allowing coaches to adjust rotation strategies without relying solely on subjective reports.
Application to Performance Projections in Team Events
Performance models increasingly incorporate recovery timelines as weighted variables when forecasting match outcomes. Projections gain accuracy when historical recovery distributions replace uniform assumptions about player freshness. In team events such as league playoffs or continental tournaments, the cumulative effect of multiple short-recovery cycles becomes a decisive input. Data sets compiled by UEFA medical panels show that squads maintaining at least 70 percent of players above a defined recovery threshold achieve higher win percentages in the final stages of competitions.
Those who model these variables use regression techniques that blend match-load metrics with individual recovery curves. The resulting simulations adjust expected goal differentials or point margins accordingly. For instance, a team entering a quarterfinal with three players still inside the 96-hour recovery window sees projected output lowered by roughly 8-12 percent in high-intensity metrics, according to internal club analytics reports shared at sports science conferences.
Monitoring Tools and Their Role in Reducing Projection Error
Wearable devices and blood biomarker panels now supply granular inputs that narrow variance estimates. Heart-rate recovery tests conducted 24 hours post-match correlate strongly with subsequent performance decrements when thresholds drop below established norms. Teams employing these protocols report fewer instances of unexpected underperformance during critical fixtures. Canadian research groups have validated similar approaches in ice hockey, where shift-duration data combined with recovery scores improves lineup optimization accuracy by measurable margins.
Integration of these tools into broader projection frameworks requires careful calibration because baseline values differ across populations. Practitioners calibrate models seasonally using league-specific data sets rather than generic benchmarks, which reduces systematic bias in forecasts. The approach proves particularly useful when international windows create additional recovery challenges for traveling players.
Conclusion
Variance in recovery timelines supplies a measurable lever for refining performance projections across team events. Objective tracking of physiological markers, positional demands, and schedule density allows analysts to move beyond averaged assumptions toward individualized forecasts. As competition calendars evolve through 2026 and beyond, organizations that embed recovery data into planning processes gain clearer visibility into likely output ranges for upcoming matches.