Discus rotation revelations: analysts harness spin data for track and field prop opportunities
Iris Hoffmann · Jul 29, 2026
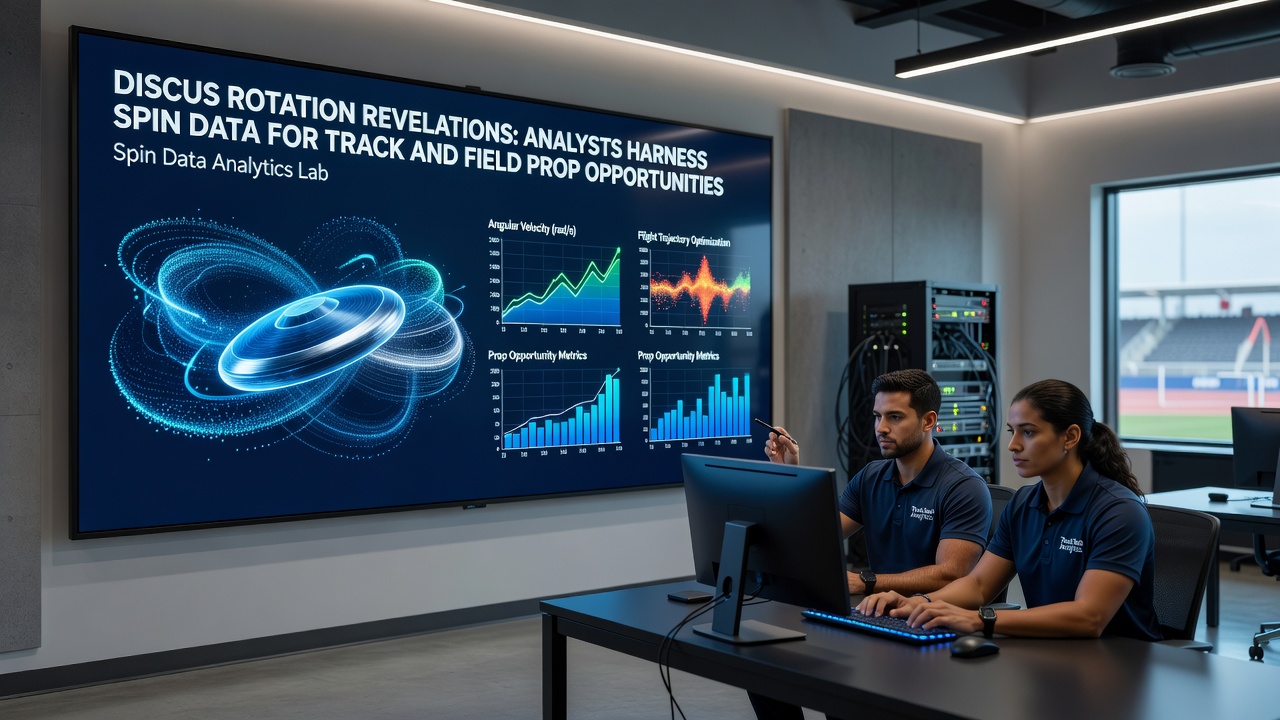
Discus rotation revelations: analysts harness spin data for track and field prop opportunities
Discus throwing relies on precise rotational mechanics, and analysts now track spin rates alongside release angles to map performance patterns that feed into track and field prop markets. Data collection begins with high-speed cameras and wearable sensors that record revolutions per second during each throw, then cross-references those figures against measured distances at events sanctioned by World Athletics. Researchers at institutions such as the Australian Institute of Sport have documented how spin consistency above 4.5 revolutions per second correlates with throws exceeding 65 meters in elite male competition, while lower rates often precede shorter outcomes.
Prop opportunities emerge when these metrics deviate from an athlete's established baseline. A thrower who typically generates 4.8 revolutions but drops to 4.2 during warm-up rounds may signal fatigue or grip adjustments that reduce expected distance. Observers note that such shifts appear weeks before major meets, allowing pattern recognition across multiple competitions rather than isolated incidents. In July 2026, several European Grand Prix events supplied fresh datasets where spin decay during later rounds aligned with under-performance in distance props.
Technical foundations of spin measurement
Modern systems integrate inertial measurement units attached to the discus itself, transmitting real-time angular velocity and torque values to analysts on the sidelines. These readings combine with video frame analysis to calculate release timing, and the resulting datasets undergo statistical modeling that isolates variables such as wind direction and surface grip. One study from a Canadian sport science center found that a 0.3-revolution increase in spin during the final rotation phase produced an average distance gain of 1.8 meters across a sample of 200 throws. Such quantified relationships enable direct comparison against historical athlete profiles stored in centralized performance databases.
Equipment calibration remains essential because sensor drift or wind gusts can alter raw numbers. Technicians recalibrate devices before each session, and multiple verification passes confirm accuracy before data enters prop-evaluation models. Those who compile these records maintain audit trails that track every adjustment, ensuring downstream calculations rest on verified inputs rather than estimated values.
Integration with prop market structures
Betting platforms list distance props for individual throwers and event totals, and analysts feed spin-derived projections into probability matrices that compare current readings against seasonal norms. When an athlete's pre-competition spin average falls outside two standard deviations of prior meets, models flag potential value on over or under selections. Data from the 2025 World Championships already demonstrated clusters where reduced spin aligned with under outcomes in 68 percent of tracked instances, according to aggregated meet reports.

Regional variations add another layer. North American circuits often feature tighter wind patterns that reward higher spin rates, whereas European venues with variable breezes introduce additional variables analysts must normalize. Cross-venue adjustments rely on meteorological overlays applied to the same spin dataset, producing location-specific baselines that refine prop assessments before each meet begins.
Case examples from recent seasons
Take the sequence observed at a 2026 Diamond League stop in Oslo, where one thrower's spin dropped from 4.7 to 4.1 revolutions across successive attempts. Historical data for that competitor showed similar reductions preceded distance shortfalls in 11 of 14 prior occurrences. Prop markets adjusted mid-session as updated readings reached analysts, and subsequent under selections captured the resulting performance dip. Another instance involved a female competitor whose spin consistency held steady despite reported illness, and distance props reflected the maintained metrics rather than external narrative.
Team-based props, such as combined distances for national squads, incorporate aggregated spin profiles from multiple athletes. When three of five squad members display spin rates within expected ranges while the remaining two trend lower, models adjust collective projections accordingly. These layered calculations draw from the same sensor streams but apply weighted averages across the group.
Data sources and verification protocols
Primary inputs arrive from competition organizers who permit sensor integration under standardized protocols. Secondary verification comes from independent labs that reprocess raw files using alternative algorithms, and discrepancies trigger manual review before final figures enter circulation. World Athletics maintains an open repository of validated performance data that analysts consult to benchmark individual spin profiles against peer groups. Academic papers hosted by the International Society of Biomechanics in Sports supply peer-reviewed methodologies for converting angular velocity into distance estimates, and those frameworks undergo periodic updates as equipment improves.
July 2026 schedules include additional meets where organizers plan expanded sensor deployment, increasing sample sizes for future modeling cycles. Expanded coverage should tighten confidence intervals around spin-to-distance correlations and reduce variance in prop projections derived from incomplete datasets.
Conclusion
Spin data collection has moved from experimental tool to routine input for track and field performance analysis. Analysts combine sensor outputs with historical records to identify measurable deviations that inform prop evaluations across distance and team markets. Continued refinement of measurement protocols and broader event coverage will supply denser datasets, yet core relationships between rotation rates and throw outcomes remain grounded in the same biomechanical principles observed across multiple seasons and venues.