Cross-Sport Fatigue Mapping Through Consecutive Fixture Analysis in Football, Basketball and Tennis Circuits
Anna Peters · Jun 26, 2026
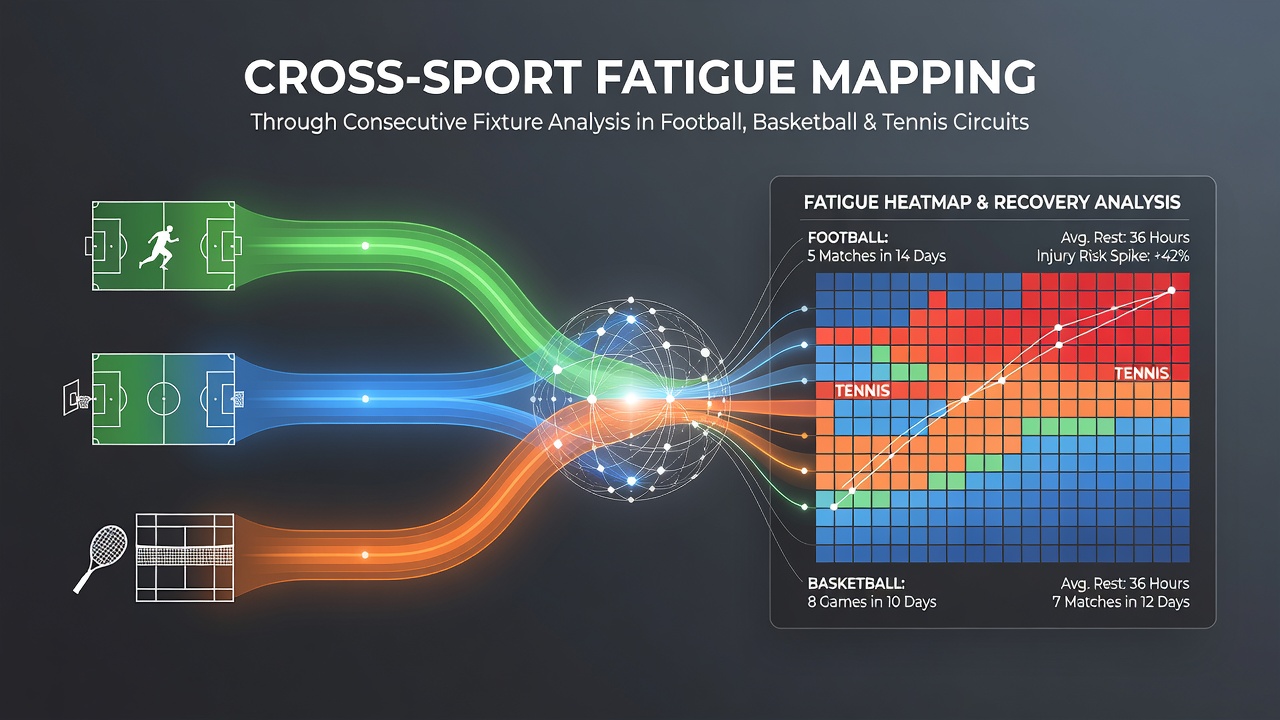
Cross-Sport Fatigue Mapping Through Consecutive Fixture Analysis in Football, Basketball and Tennis Circuits
Researchers track fatigue across football, basketball and tennis by examining consecutive fixtures and the recovery windows between them, and data from multiple seasons shows how travel, match density and physical demands interact. Studies conducted by the Australian Institute of Sport and published in the Journal of Sports Sciences have mapped these patterns using GPS and heart-rate variability metrics collected from elite athletes between 2022 and 2025.
Football Fixture Density and Recovery Windows
Football leagues schedule matches with varying gaps, and analysts have examined how back-to-back games within four days affect muscle soreness and sprint performance. Data from the UEFA Elite Club Injury Study, covering more than 20 top European clubs, indicates that injury incidence rises 18 percent when teams play three matches in eight days compared with two matches in the same period. Observers note that midfielders and full-backs register the largest drops in high-intensity running distance after compressed schedules, while goalkeepers show smaller changes in workload metrics.
Consecutive fixture analysis also incorporates travel distance, and European clubs logging more than 3,000 kilometres between matches demonstrate slower return-to-baseline neuromuscular scores. Figures from the German Football League’s performance database reveal that teams with midweek Champions League fixtures followed by domestic league games on the weekend post reduced pass-completion rates in the first half of the second match.
Basketball Back-to-Back Patterns and Load Accumulation
Basketball circuits present a different profile because the NBA regular season routinely includes three or four games in five days during certain stretches. Player-tracking data released by the league’s analytics department shows that second-night back-to-backs produce a measurable decline in average sprint speed of 4.2 percent and an increase in turnovers of 7 percent relative to games played after two or more rest days. Researchers at the University of Waterloo examined 1,200 NBA games across the 2023-24 and 2024-25 seasons and found that centres accumulate the highest internal load during these sequences, while perimeter players exhibit greater external load through increased three-point attempts when fatigued.
International tournaments add another layer, and FIBA World Cup qualifying windows often force national-team players into rapid transitions between club and country commitments. Those who studied these schedules observed that athletes returning from overseas trips within 48 hours of a domestic game record elevated creatine-kinase levels persisting into the subsequent contest.
Tennis Tournament Scheduling and Consecutive Match Load
Tennis circuits require athletes to compete on consecutive days during the early rounds of many events, and the ATP and WTA maintain detailed match-duration statistics that allow fatigue mapping across surfaces. A longitudinal study coordinated by the University of Queensland tracked 180 professional players over 18 months and reported that matches lasting more than two hours and forty minutes followed by another match within 24 hours correlate with a 22 percent reduction in serve velocity on the second day. Clay-court events produce longer rallies on average, and data collected during the 2025 European swing shows higher heart-rate recovery times after three consecutive days of play compared with hard-court sequences.
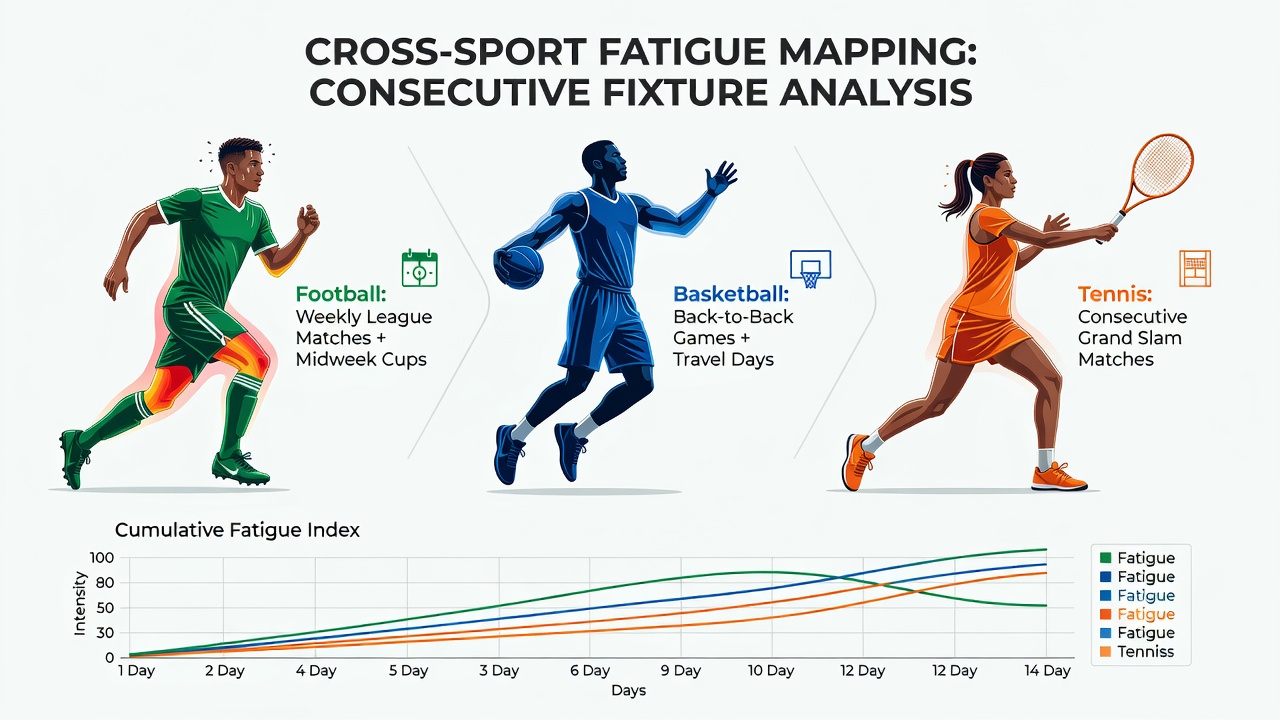
Grand Slam draws extend over two weeks, and players who advance deep into both singles and doubles events experience compounded fatigue. Tournament medical reports from the 2025 US Open documented that participants contesting more than 12 sets across five days displayed slower reaction times in post-match testing, although individual recovery strategies such as sleep extension and targeted cryotherapy moderated some of the measured decline.
Cross-Sport Comparisons of Fatigue Indicators
When researchers align metrics across the three sports, certain common thresholds emerge. A joint analysis by the IOC Medical Commission and academic partners in Canada and Australia found that athletes in all three disciplines show consistent drops in countermovement jump height after four consecutive high-load days, regardless of sport-specific movement patterns. Football players register the steepest decline after 72 hours of accumulated match time, basketball players after 90 minutes of court time per day over three days, and tennis players after total match duration exceeding six hours across two days.
Travel across time zones adds a shared variable, and data collected during the 2026 June international windows, when football nations competed in CONMEBOL and UEFA qualifiers while basketball teams prepared for FIBA windows and tennis players contested grass-court events in Europe, indicated that westward travel of more than six hours amplifies next-day performance decrements by an additional 3 to 5 percent across all measured sports.
Monitoring Technologies and Data Integration
Modern fatigue mapping relies on integrated systems that combine wearable sensors, session-RPE questionnaires and fixture calendars. Clubs and national federations increasingly feed these streams into central dashboards, allowing performance staff to adjust training loads in real time. European football academies have adopted algorithms that flag players whose acute-to-chronic workload ratios exceed 1.5 following congested periods, while several NBA franchises use similar models calibrated to basketball-specific movement counts. Tennis national federations have begun incorporating menstrual-cycle tracking alongside load data to refine individual recovery recommendations for female athletes.
Conclusion
Consecutive fixture analysis supplies a practical framework for understanding how scheduling interacts with physiological recovery across football, basketball and tennis. Continued collection of standardized metrics from diverse geographic regions and competition levels will refine these maps, enabling governing bodies and teams to adjust calendars and support protocols based on evidence rather than assumption.