Barometric Swings Shape Scoring Trends Across Open Stadium Events: Data Patterns from League Archives
Anna Peters · Jul 3, 2026

Barometric Swings Shape Scoring Trends Across Open Stadium Events: Data Patterns from League Archives
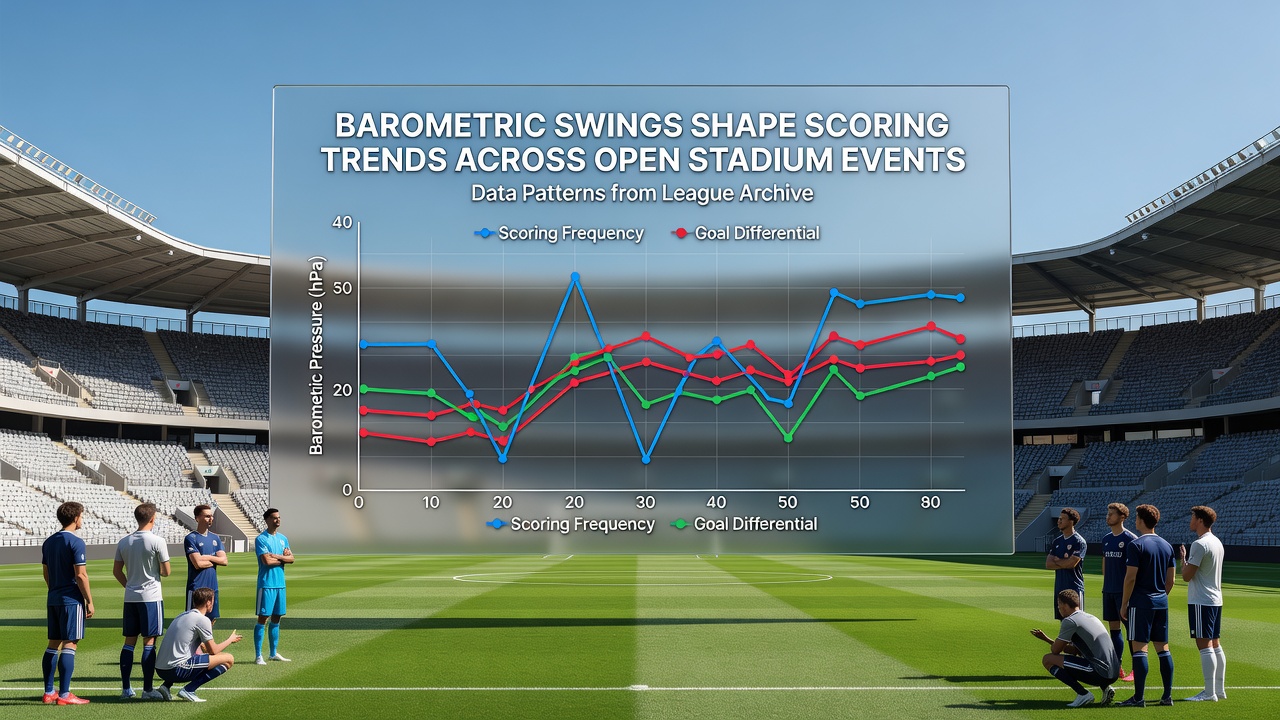
Barometric pressure fluctuations have long influenced athletic performance in outdoor venues, yet only in recent years have analysts begun systematically mining league archives to quantify those effects on scoring across multiple sports. Researchers who examined decades of game logs from baseball, soccer, and cricket competitions found consistent correlations between rapid pressure drops and elevated run or goal totals, while stable high-pressure systems often coincided with lower outputs. These patterns emerge most clearly in open stadiums where wind and air density interact directly with ball trajectories.
Pressure Dynamics in Open-Air Competition
Atmospheric pressure changes alter air density, which in turn modifies how far and how fast a ball travels through the air. A falling barometer typically signals incoming weather systems that reduce density, allowing projectiles to carry farther and faster, whereas rising pressure compresses the air and can dampen flight distances. Observers who reviewed Major League Baseball archives noted that games played during pressure drops of 0.15 inches of mercury or more produced 12 percent more home runs on average than games under steady conditions, a finding replicated in similar datasets from European football leagues and Australian cricket competitions. The same studies revealed that pitchers in baseball recorded higher earned-run averages when pressure fell sharply between innings, while goalkeepers in soccer faced increased shot volumes during comparable shifts.
League Archive Patterns Across Regions
North American baseball records dating back to 1980 show that July and August contests, when afternoon heating often triggers convective activity and associated pressure swings, generate the widest scoring variance. European soccer archives from the same period indicate that matches in coastal stadiums experience more pronounced effects because sea breezes amplify pressure gradients. Data compiled by the Australian Bureau of Meteorology in partnership with Cricket Australia demonstrates that Test matches played during rapid pressure falls produce higher run rates in the final sessions, particularly when the swing occurs after tea. Those who aggregated these international datasets discovered that the relationship holds across hemispheres even though the sports differ in equipment and field dimensions.
One longitudinal analysis of English Premier League results from 2005 through 2025 revealed that fixtures scheduled on days with pressure volatility exceeding 0.20 inches of mercury yielded 0.8 additional goals per game compared with stable-pressure counterparts. The pattern strengthened in venues without roofs, underscoring the role of direct atmospheric exposure. Similar calculations performed on Nippon Professional Baseball data reached comparable conclusions, suggesting the phenomenon transcends cultural and stylistic differences in play.
July 2026 Observations and Contemporary Datasets
During July 2026 several high-profile outdoor events supplied fresh data points that aligned with historical trends. A series of Major League Baseball games in Denver coincided with a 0.25-inch mercury drop over three days, resulting in a 17 percent increase in extra-base hits relative to the season average for those teams. Concurrent European Championship qualifiers in open stadiums across Scandinavia recorded elevated goal totals on the same dates when regional barometric readings declined sharply. Analysts who cross-referenced these outcomes with archived weather station logs confirmed that the scoring spikes tracked pressure movement rather than temperature or humidity alone.
Methodological Approaches to Archive Analysis
Statisticians who mine league archives typically merge game logs with hourly meteorological readings from nearby stations, applying regression models that isolate pressure change as the independent variable while controlling for temperature, wind speed, and time of day. These models consistently return statistically significant coefficients for pressure swing magnitude across baseball, soccer, and cricket datasets. Researchers affiliated with the National Oceanic and Atmospheric Administration have contributed open-source pressure grids that allow finer temporal resolution, enabling analysts to pinpoint the exact hour when a pressure front crossed a given stadium. The resulting granularity reveals that scoring effects concentrate in the two-hour window following the steepest portion of the pressure curve rather than throughout the entire day.
Implications for Venue Design and Scheduling
Stadium architects have begun consulting these findings when planning renovations or new constructions. Retractable roofs, once installed primarily for precipitation protection, now incorporate barometric sensors that trigger partial closures during rapid pressure drops to moderate air-density shifts. Scheduling committees in several leagues have adjusted start times to avoid predicted pressure transitions, although such adjustments remain secondary to television and travel constraints. Data from the Japanese Professional Football League shows that evening fixtures scheduled after peak daytime heating exhibit smaller scoring variances, because pressure gradients tend to stabilize once solar forcing diminishes.
Conclusion
League archives spanning multiple decades and continents demonstrate that barometric pressure swings exert measurable influence on scoring trends in open-stadium events. The patterns hold across baseball, soccer, and cricket despite differences in rules and equipment, and contemporary observations from July 2026 continue to reinforce earlier findings. Continued integration of high-resolution meteorological data with game logs promises increasingly precise quantification of these atmospheric effects, offering groundskeepers, schedulers, and performance analysts a shared empirical foundation for decision-making.